Note
Go to the end to download the full example code
Reduction from window#
This example demonstrates the reduction of windowed raster values around a point using value_at_coords().
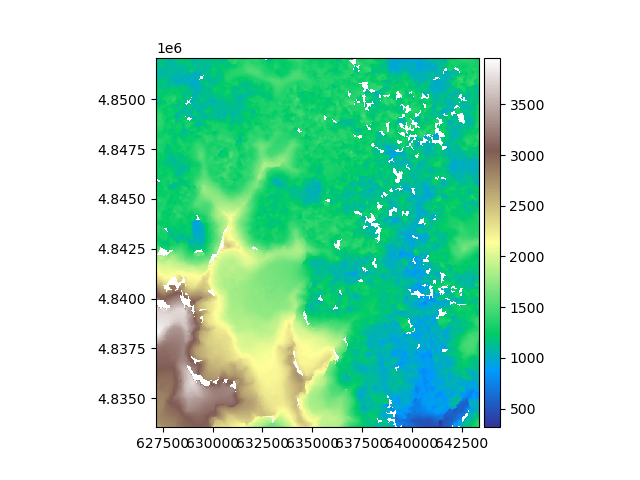
We open an example raster, a digital elevation model in South America.
import geoutils as gu

filename_rast = gu.examples.get_path("exploradores_aster_dem")
rast = gu.Raster(filename_rast)
rast.crop([rast.bounds.left, rast.bounds.bottom, rast.bounds.left + 2000, rast.bounds.bottom + 2000])

# Plot the raster
rast.plot(cmap="terrain")
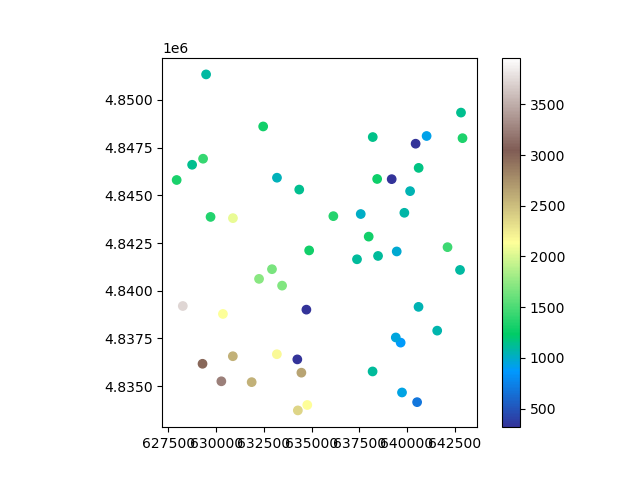
We generate a random subsample of 100 coordinates to extract.
import geopandas as gpd
import numpy as np

# Replace by Raster function once done
np.random.seed(42)
x_coords = np.random.uniform(rast.bounds.left + 50, rast.bounds.right - 50, 50)
y_coords = np.random.uniform(rast.bounds.bottom + 50, rast.bounds.top - 50, 50)

vals = rast.value_at_coords(x=x_coords, y=y_coords)
Replace by Vector function once done
<Axes: >
By default, value_at_coords() extracts the closest pixel value. But it can also be passed a window size and reductor function to
extract an average value or other statistic based on neighbouring pixels.
vals_reduced = rast.value_at_coords(x=x_coords, y=y_coords, window=5, reducer_function=np.nanmedian)

np.nanmean(vals - vals_reduced)
-490.58212
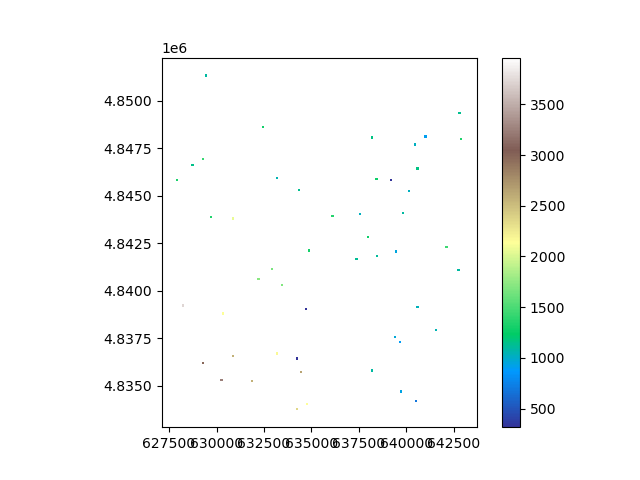
The mean difference in extracted values is quite significant at 0.3 meters! We can visualize how the sampling took place in window.
# Replace by Vector fonction once done
coords = rast.coords(grid=True)
x_closest = rast.copy(new_array=coords[0]).value_at_coords(x=x_coords, y=y_coords).squeeze()
y_closest = rast.copy(new_array=coords[1]).value_at_coords(x=x_coords, y=y_coords).squeeze()
from shapely.geometry import box

geometry = [
    box(x - 2 * rast.res[0], y - 2 * rast.res[1], x + 2 * rast.res[0], y + 2 * rast.res[1])
    for x, y in zip(x_closest, y_closest)
]
ds = gpd.GeoDataFrame(geometry=geometry, crs=rast.crs)
ds["vals"] = vals_reduced
ds.plot(column="vals", cmap="terrain", legend=True, vmin=np.nanmin(rast), vmax=np.nanmax(rast))
<Axes: >
Total running time of the script: (0 minutes 0.389 seconds)