Note
Go to the end to download the full example code
Creating a raster from array#
This example demonstrates the creation of a raster through from_array().
import numpy as np
import pyproj
import rasterio as rio
We create a data array as ndarray, a transform as affine.Affine and a coordinate reference system (CRS) as pyproj.CRS.
import geoutils as gu

# A random 3 x 3 masked array
np.random.seed(42)
arr = np.random.normal(size=(5, 5))
# Introduce a NaN value
arr[2, 2] = np.nan
# A transform with 3 x 3 pixels in a [0-1, 0-1] bound square
transform = rio.transform.from_bounds(0, 0, 1, 1, 3, 3)
# A CRS, here geographic (latitude/longitude)
crs = pyproj.CRS.from_epsg(4326)

# Create a raster
rast = gu.Raster.from_array(data=arr, transform=transform, crs=crs, nodata=255)
rast
We can print info on the raster.
Driver:               None
Opened from file:     None
Filename:             None
Loaded?               True
Modified since load?  True
Grid size:                 5, 5
Number of bands:      1
Data types:           float64
Coordinate system:    ['EPSG:4326']
Nodata value:         255
Pixel interpretation: None
Pixel size:           0.3333333333333333, 0.3333333333333333
Upper left corner:    0.0, -0.6666666666666665
Lower right corner:   1.6666666666666665, 1.0
The array has been automatically cast into a MaskedArray, to respect nodata values.
masked_array(
  data=[[0.4967141530112327, -0.13826430117118466, 0.6476885381006925,
         1.5230298564080254, -0.23415337472333597],
        [-0.23413695694918055, 1.5792128155073915, 0.7674347291529088,
         -0.4694743859349521, 0.5425600435859647],
        [-0.46341769281246226, -0.46572975357025687, --,
         -1.913280244657798, -1.7249178325130328],
        [-0.5622875292409727, -1.0128311203344238, 0.3142473325952739,
         -0.9080240755212109, -1.4123037013352915],
        [1.465648768921554, -0.22577630048653566, 0.06752820468792384,
         -1.4247481862134568, -0.5443827245251827]],
  mask=[[False, False, False, False, False],
        [False, False, False, False, False],
        [False, False,  True, False, False],
        [False, False, False, False, False],
        [False, False, False, False, False]],
  fill_value=255.0)
We could also have created directly from a MaskedArray.
# A random mask, that will mask one out of two values on average
mask = np.random.randint(0, 2, size=(5, 5), dtype="bool")
ma = np.ma.masked_array(data=arr, mask=mask)

# This time, we pass directly the masked array
rast = gu.Raster.from_array(data=ma, transform=transform, crs=crs, nodata=255)
rast
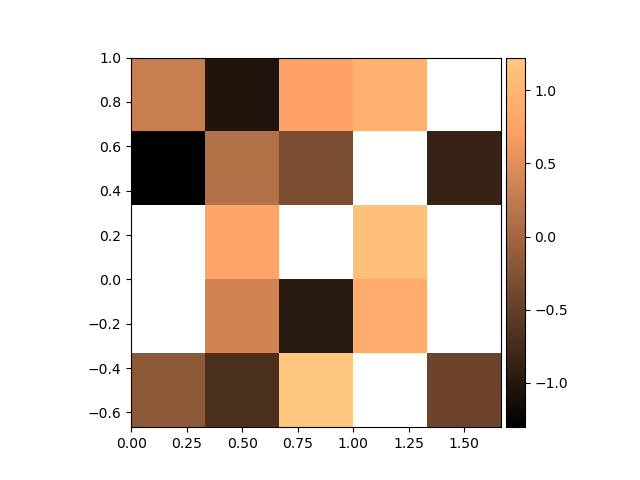
The different functionalities of GeoUtils will respect nodata values, starting with show(),
which will ignore them during plotting (transparent).
rast.plot(cmap="copper")
Total running time of the script: (0 minutes 0.089 seconds)