Note
Go to the end to download the full example code.
Reproject a raster#
This example demonstrates the reprojection of a raster using geoutils.Raster.reproject().
We open two example rasters.
import geoutils as gu

filename_rast1 = gu.examples.get_path("everest_landsat_b4")
filename_rast2 = gu.examples.get_path("everest_landsat_b4_cropped")
rast1 = gu.Raster(filename_rast1)
rast2 = gu.Raster(filename_rast2)
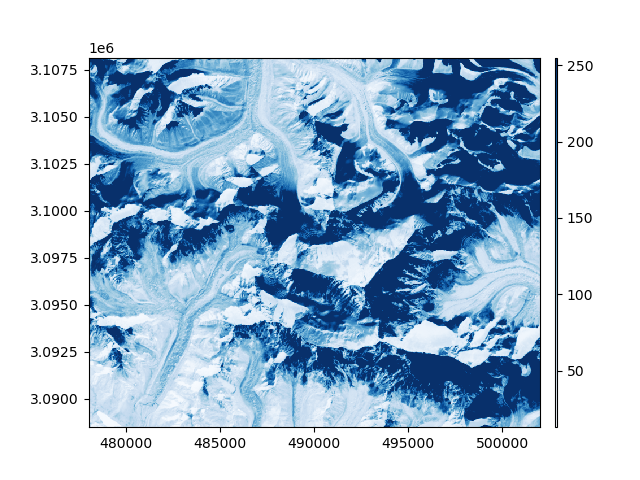
The first raster has larger extent and higher resolution than the second one.
rast1.info()
rast2.info()
Driver:               GTiff
Filename:             /home/docs/checkouts/readthedocs.org/user_builds/geoutils/checkouts/latest/geoutils/example_data/Everest_Landsat/LE71400412000304SGS00_B4.tif
Loaded?               False
Grid size:            800, 655
Number of bands:      1
Data types:           uint8
Coordinate system:    ['EPSG:32645']
Nodata value:         None
Pixel interpretation: Point
Pixel size:           30.0, 30.0
Upper left corner:    478000.0, 3108140.0
Lower right corner:   502000.0, 3088490.0

Driver:               GTiff
Filename:             /home/docs/checkouts/readthedocs.org/user_builds/geoutils/checkouts/latest/geoutils/example_data/Everest_Landsat/LE71400412000304SGS00_B4_cropped.tif
Loaded?               False
Grid size:            492, 315
Number of bands:      1
Data types:           uint8
Coordinate system:    ['EPSG:32645']
Nodata value:         None
Pixel interpretation: Area
Pixel size:           30.0, 30.0
Upper left corner:    483430.0, 3102710.0
Lower right corner:   498190.0, 3093260.0
Let’s plot the first raster, with the warped extent of the second one.
rast1.plot(cmap="Blues")
vect_bounds_rast2 = gu.Vector.from_bounds_projected(rast2)
vect_bounds_rast2.plot(fc="none", ec="r", lw=2)
First option: using the second raster as a reference to match, we reproject the first one. We simply have to pass the second Raster
as single argument to reproject(). See Match-reference functionality for more details.
By default, a “bilinear” resampling algorithm is used. Any string or Resampling can be passed.
/home/docs/checkouts/readthedocs.org/user_builds/geoutils/checkouts/latest/geoutils/raster/referencing.py:230: UserWarning: One raster has a pixel interpretation "Area" and the other "Point". To silence this warning, either correct the pixel interpretation of one raster, or deactivate warnings of pixel interpretation with geoutils.config["warn_area_or_point"]=False.
  warnings.warn(message=msg, category=UserWarning)
/home/docs/checkouts/readthedocs.org/user_builds/geoutils/checkouts/latest/geoutils/raster/transformation.py:142: UserWarning: For reprojection, nodata must be set. Default chosen value 255 exists in self.data. This may have unexpected consequences. Consider setting a different nodata with self.set_nodata().
  warnings.warn(
Note
Because no geoutils.Raster.nodata value is defined in the original image, the default value 255 for numpy.uint8 is used. This
value is detected as already existing in the original raster, however, which raises a UserWarning. If your geoutils.Raster.nodata is not defined,
use geoutils.Raster.set_nodata().
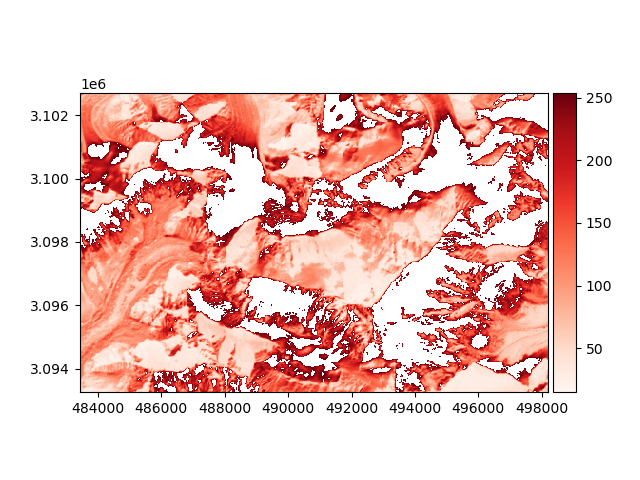
Now the shape and georeferencing should be the same as that of the second raster, shown above.
Driver:               None
Filename:             None
Loaded?               True
Grid size:            492, 315
Number of bands:      1
Data types:           uint8
Coordinate system:    ['EPSG:32645']
Nodata value:         255
Pixel interpretation: Point
Pixel size:           30.0, 30.0
Upper left corner:    483430.0, 3102710.0
Lower right corner:   498190.0, 3093260.0
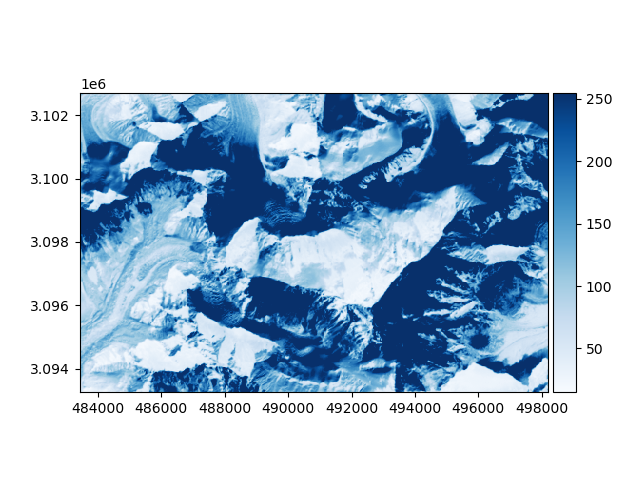
We can plot the two rasters next to one another
rast1_warped.plot(ax="new", cmap="Reds")
rast2.plot(ax="new", cmap="Blues")
Second option: we can pass any georeferencing argument to reproject(), such as dst_size and dst_crs, and will only
deduce other parameters from the raster from which it is called (for dst_crs, an EPSG code can be passed directly as int).
# Ensure the right nodata value is set
rast2.set_nodata(0)
# Pass the desired georeferencing parameters
rast2_warped = rast2.reproject(grid_size=(100, 100), crs=32645)
rast2_warped.info()
Driver:               None
Filename:             None
Loaded?               True
Grid size:            100, 100
Number of bands:      1
Data types:           uint8
Coordinate system:    ['EPSG:32645']
Nodata value:         0
Pixel interpretation: Area
Pixel size:           147.6, 94.5
Upper left corner:    483430.0, 3102710.0
Lower right corner:   498190.0, 3093260.0
Total running time of the script: (0 minutes 1.869 seconds)