Distance operations#
Computing distance between sets of geospatial data or manipulating their shape based on distance is often important for later analysis. To facilitate this type of operations, GeoUtils implements distance-specific functionalities for both vectors and rasters.
Tip
It is often important to compute distances in a metric CRS. For this, reproject (with
reproject()) to a local metric CRS (that can be estimated with get_metric_crs()).
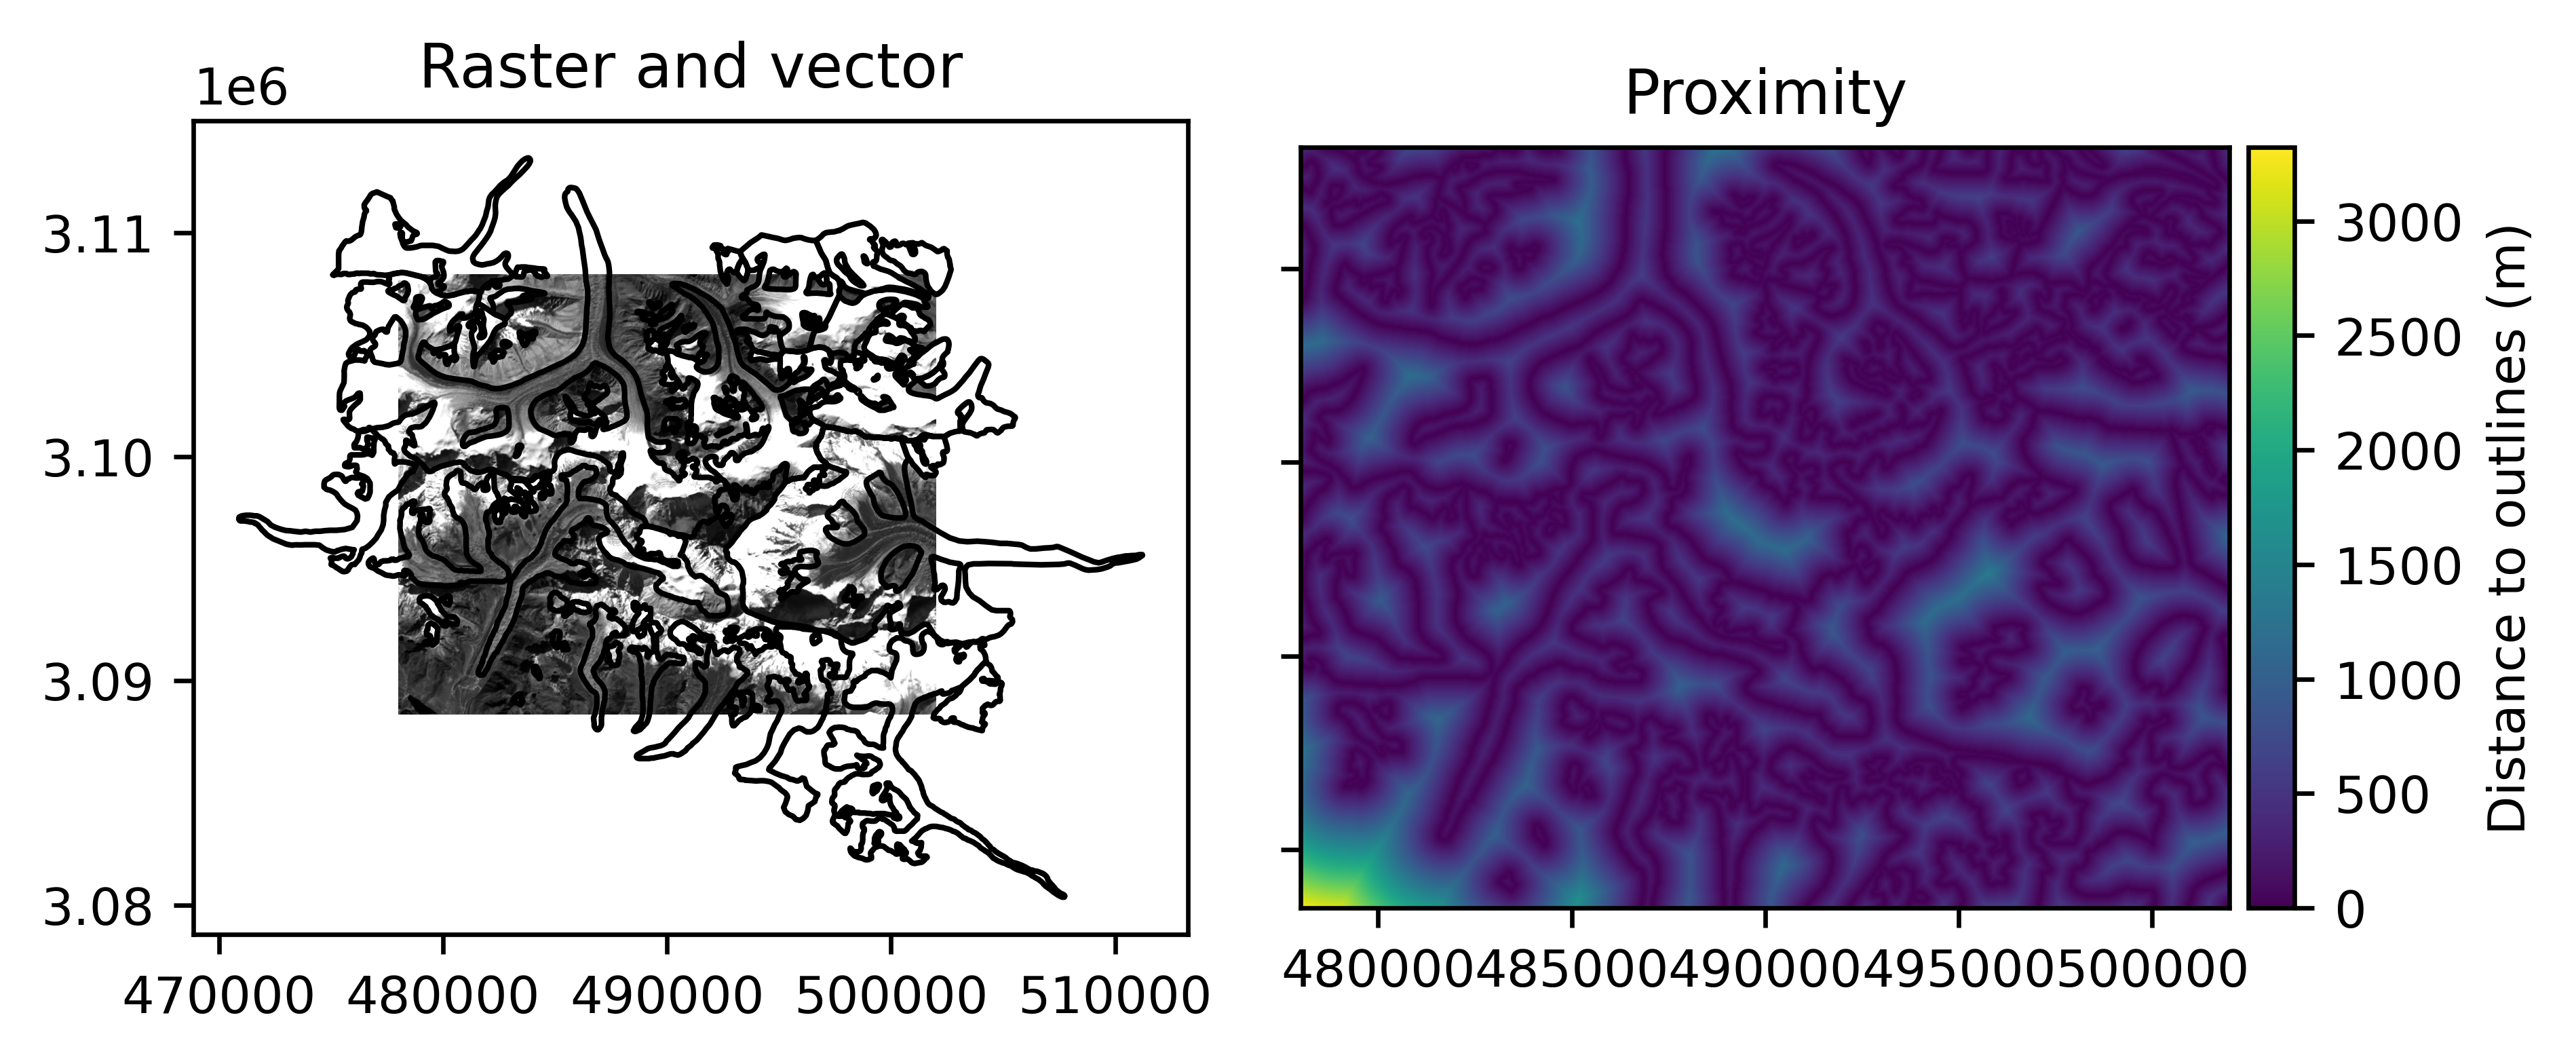
Proximity#
Proximity corresponds to the distance to the closest target geospatial data, computed on each pixel of a raster’s grid. The target geospatial data can be either a vector or a raster.
geoutils.Raster.proximity() and geoutils.Vector.proximity()
# Compute proximity to vector outlines
proximity = vect.proximity(rast)
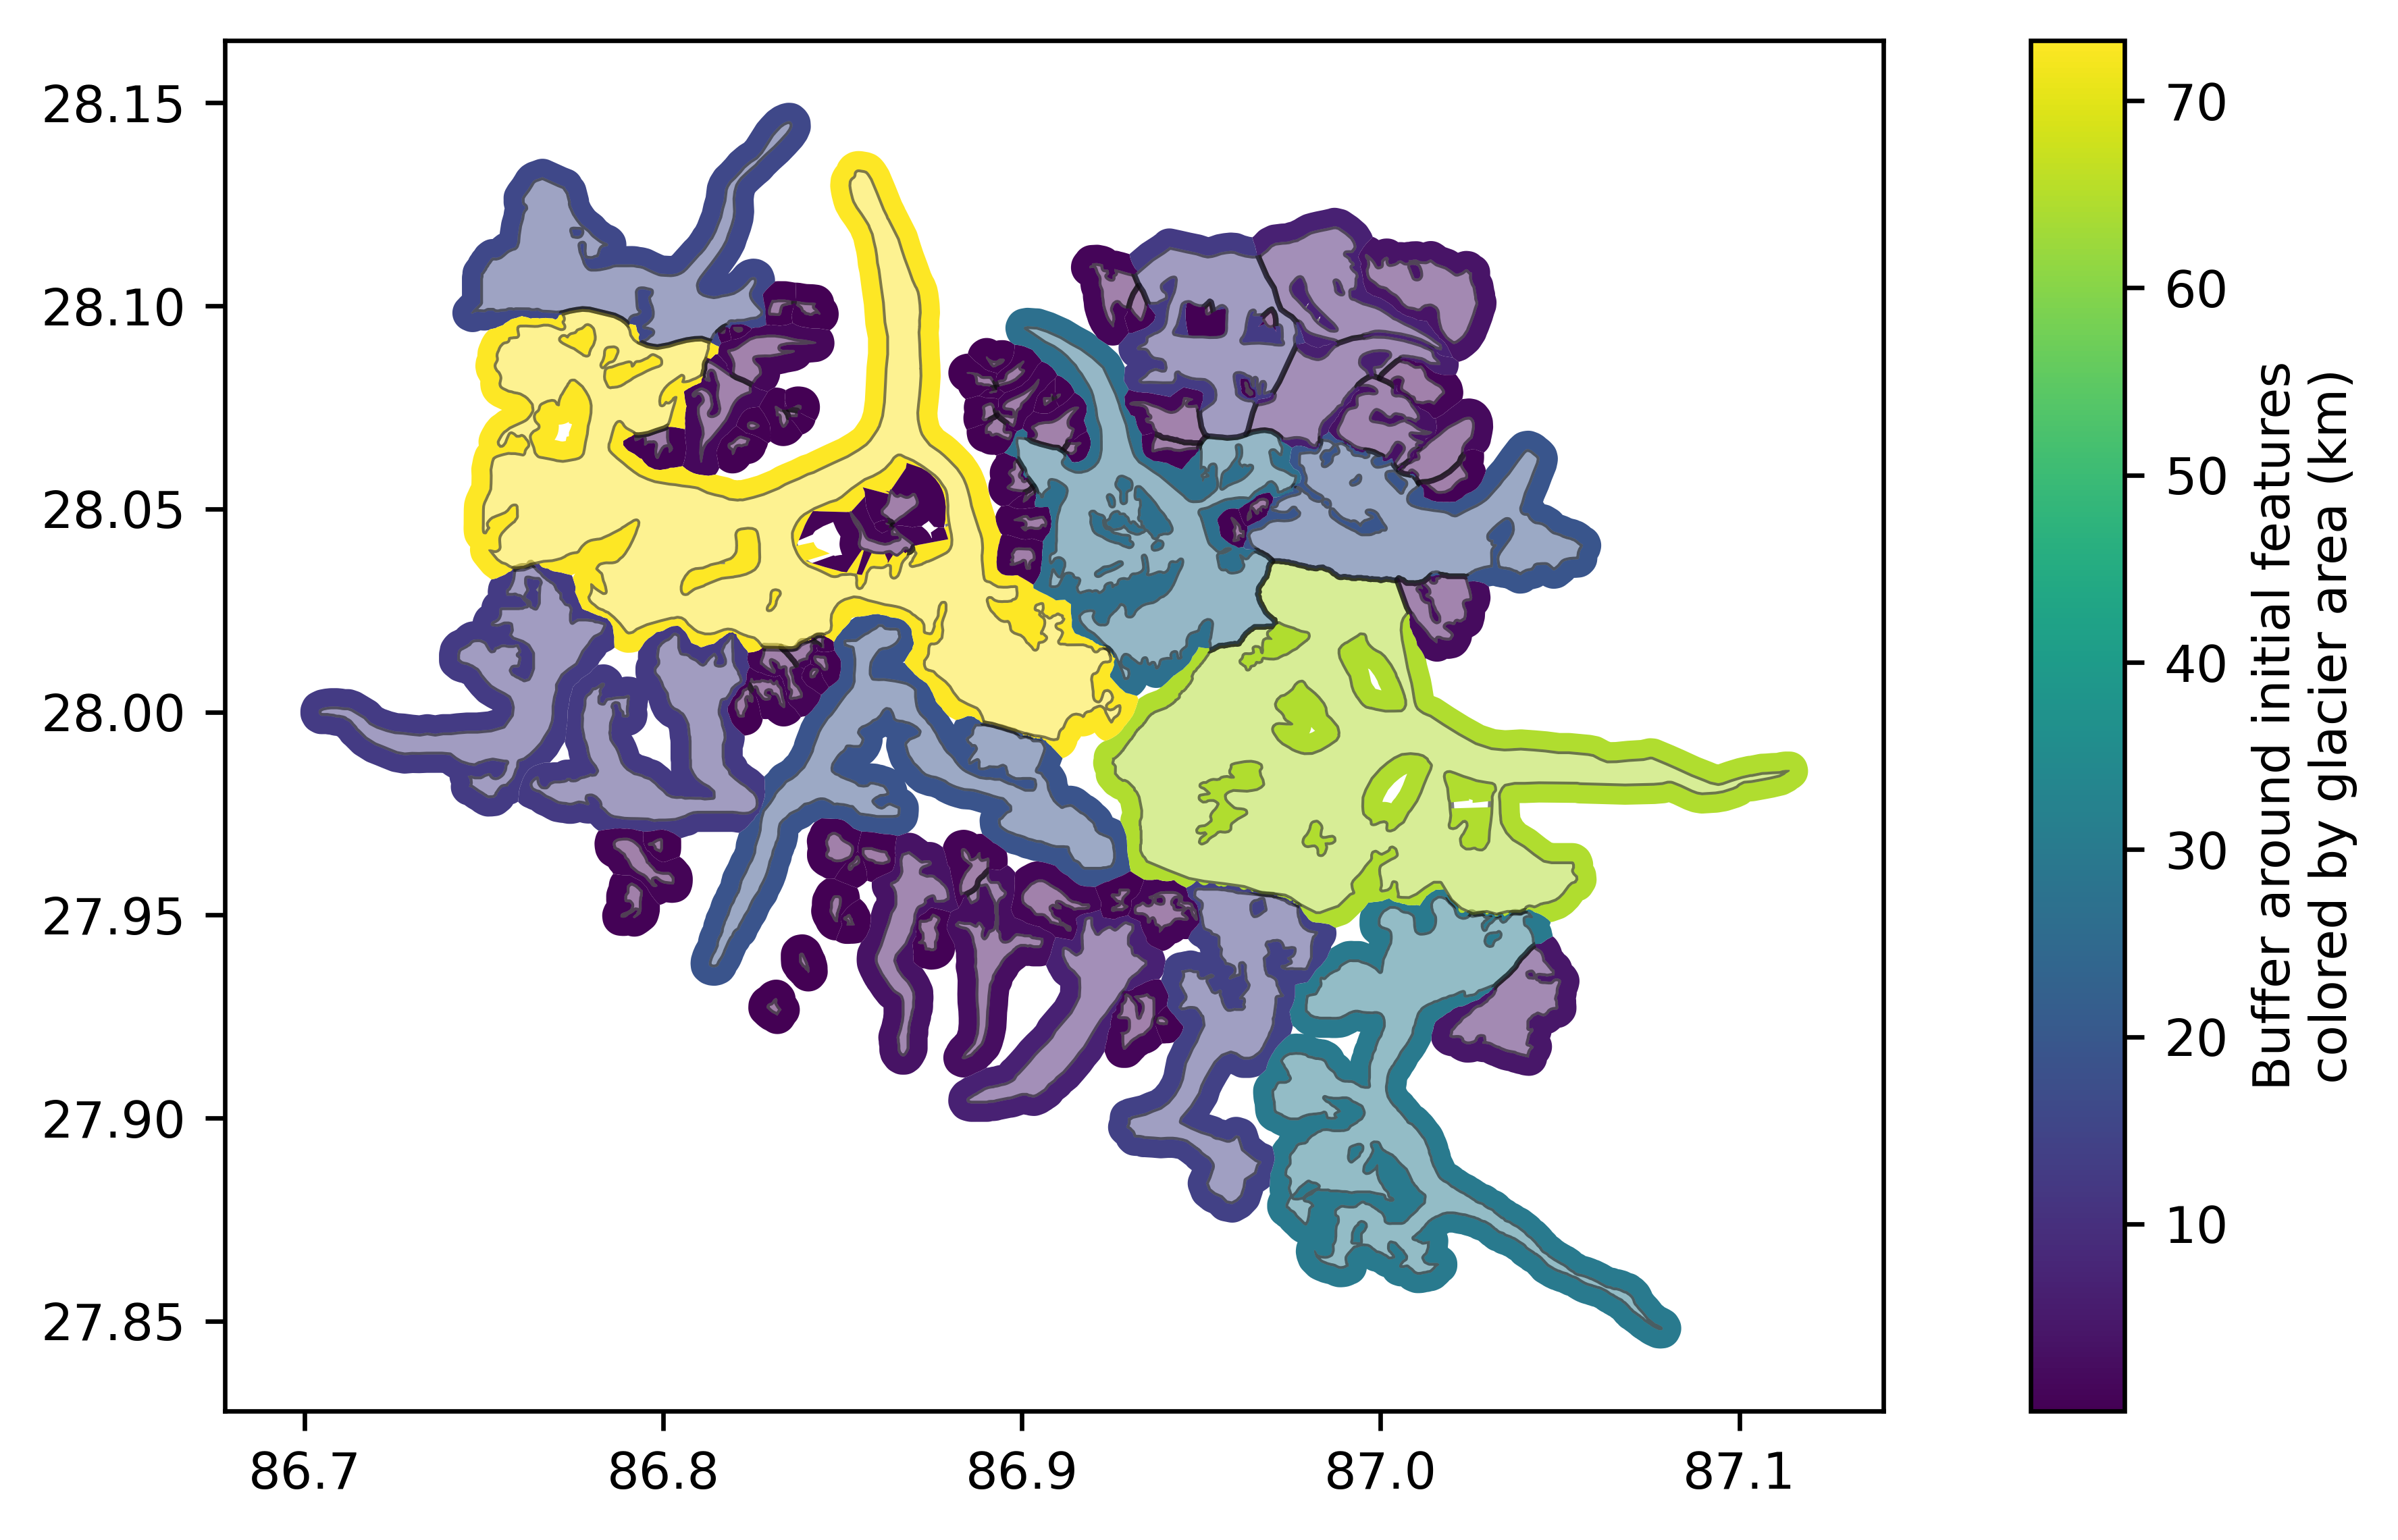
Buffering without overlap#
Buffering consists in expanding or collapsing vector geometries equally in all directions. However, this can often lead to overlap between shapes, which is sometimes undesirable. Using Voronoi polygons, we provide a buffering method without overlap.
geoutils.Vector.buffer_without_overlap()
# Compute buffer without overlap from vector exterior
vect_buff_nolap = vect.buffer_without_overlap(buffer_size=500)