Note
Go to the end to download the full example code.
Crop a raster#
This example demonstrates the cropping of a raster using geoutils.Raster.crop().
We open a raster and vector, and subset the latter.
import geoutils as gu

filename_rast = gu.examples.get_path("everest_landsat_b4")
filename_vect = gu.examples.get_path("everest_rgi_outlines")
rast = gu.Raster(filename_rast)
vect = gu.Vector(filename_vect)
vect = vect[vect["RGIId"] == "RGI60-15.10055"]
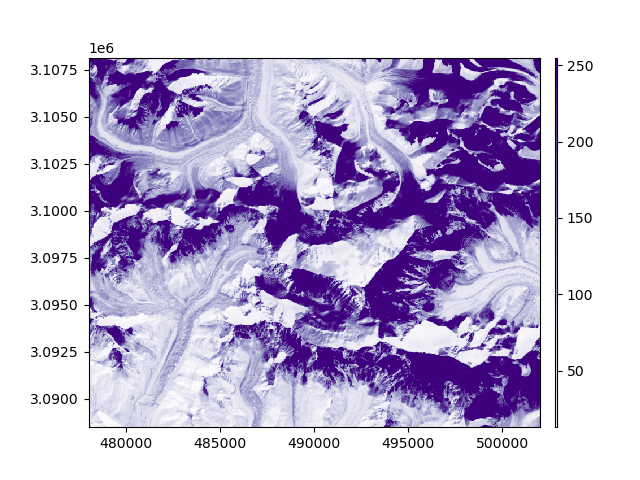
The first raster has larger extent and higher resolution than the vector.
rast.info()
print(vect.bounds)
Driver:               GTiff
Opened from file:     /home/docs/checkouts/readthedocs.org/user_builds/geoutils/checkouts/stable/examples/data/Everest_Landsat/LE71400412000304SGS00_B4.tif
Filename:             /home/docs/checkouts/readthedocs.org/user_builds/geoutils/checkouts/stable/examples/data/Everest_Landsat/LE71400412000304SGS00_B4.tif
Loaded?               False
Modified since load?  False
Grid size:                 800, 655
Number of bands:      1
Data types:           uint8
Coordinate system:    ['EPSG:32645']
Nodata value:         None
Pixel interpretation: Point
Pixel size:           30.0, 30.0
Upper left corner:    478000.0, 3088490.0
Lower right corner:   502000.0, 3108140.0

BoundingBox(left=86.89820460200008, bottom=28.00781958500005, right=86.97674208800004, top=28.095011473000056)
Let’s plot the raster and vector.

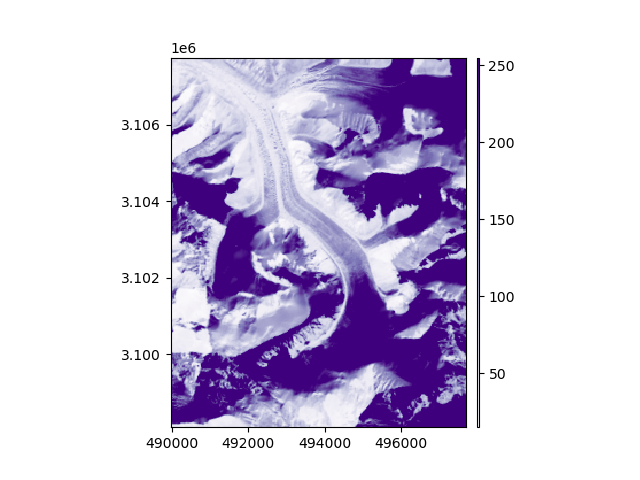
First option: using the vector as a reference to match, we reproject the raster. We simply have to pass the Vector
as single argument to crop(). See Match-reference functionality for more details.
Now the bounds should be the same as that of the vector (within the size of a pixel as the grid was not warped).
Note
By default, crop() is done in-place, replacing rast. This behaviour can be modified by passing inplace=False.

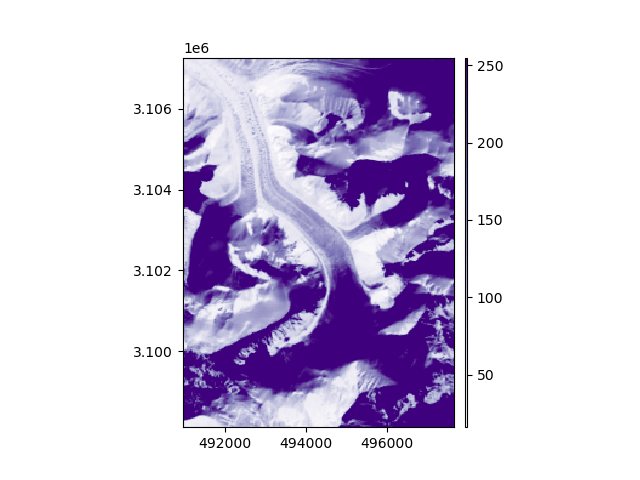
Second option: we can pass other crop_geom argument to crop(), including another Raster or a
simple tuple of bounds. For instance, we can re-crop the raster to be smaller than the vector.
rast.crop((rast.bounds.left + 1000, rast.bounds.bottom, rast.bounds.right, rast.bounds.top - 500), inplace=True)
rast.plot(ax="new", cmap="Purples")
vect.plot(ref_crs=rast, fc="none", ec="k", lw=2)

Total running time of the script: (0 minutes 0.471 seconds)
