Note
Go to the end to download the full example code.
Creating a raster from array#
This example demonstrates the creation of a raster through from_array().
import numpy as np
import pyproj
import rasterio as rio
We create a data array as ndarray, a transform as affine.Affine and a coordinate reference system (CRS) as pyproj.CRS.
import geoutils as gu

# A random 3 x 3 masked array
rng = np.random.default_rng(42)
arr = rng.normal(size=(5, 5))
# Introduce a NaN value
arr[2, 2] = np.nan
# A transform with 3 x 3 pixels in a [0-1, 0-1] bound square
transform = rio.transform.from_bounds(0, 0, 1, 1, 3, 3)
# A CRS, here geographic (latitude/longitude)
crs = pyproj.CRS.from_epsg(4326)

# Create a raster
rast = gu.Raster.from_array(data=arr, transform=transform, crs=crs, nodata=255)
rast
We can print info on the raster.
Driver:               None
Opened from file:     None
Filename:             None
Loaded?               True
Modified since load?  True
Grid size:                 5, 5
Number of bands:      1
Data types:           float64
Coordinate system:    ['EPSG:4326']
Nodata value:         255
Pixel interpretation: None
Pixel size:           0.3333333333333333, 0.3333333333333333
Upper left corner:    0.0, -0.6666666666666665
Lower right corner:   1.6666666666666665, 1.0
The array has been automatically cast into a MaskedArray, to respect nodata values.
masked_array(
  data=[[0.30471707975443135, -1.0399841062404955, 0.7504511958064572,
         0.9405647163912139, -1.9510351886538364],
        [-1.302179506862318, 0.12784040316728537, -0.3162425923435822,
         -0.016801157504288795, -0.85304392757358],
        [0.8793979748628286, 0.7777919354289483, --, 1.1272412069680329,
         0.4675093422520456],
        [-0.8592924628832382, 0.36875078408249884, -0.9588826008289989,
         0.8784503013072725, -0.049925910986252896],
        [-0.18486236354526056, -0.6809295444039414, 1.2225413386740303,
         -0.15452948206880215, -0.4283278221631072]],
  mask=[[False, False, False, False, False],
        [False, False, False, False, False],
        [False, False,  True, False, False],
        [False, False, False, False, False],
        [False, False, False, False, False]],
  fill_value=255.0)
We could also have created directly from a MaskedArray.
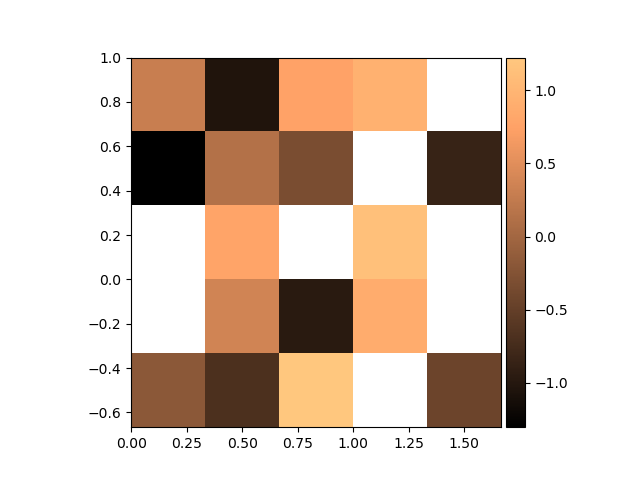
The different functionalities of GeoUtils will respect nodata values, starting with show(),
which will ignore them during plotting (transparent).
rast.plot(cmap="copper")
Total running time of the script: (0 minutes 0.086 seconds)