Note
Go to the end to download the full example code.
Interpolation from grid#
This example demonstrates the 2D interpolation of raster values to points using interp_points().
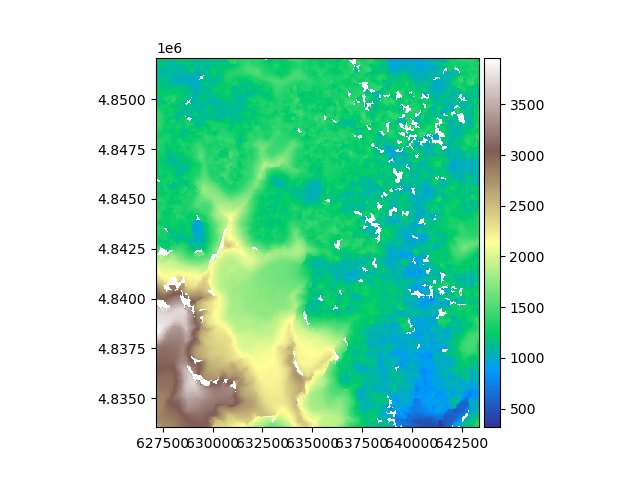
We open an example raster, a digital elevation model in South America.
import geoutils as gu

filename_rast = gu.examples.get_path("exploradores_aster_dem")
rast = gu.Raster(filename_rast)
rast.crop([rast.bounds.left, rast.bounds.bottom, rast.bounds.left + 2000, rast.bounds.bottom + 2000])

# Plot the raster
rast.plot(cmap="terrain")
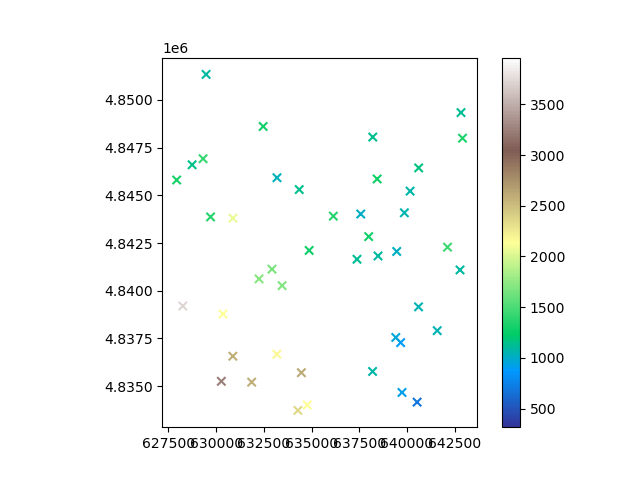
We generate a random subsample of 100 points to interpolate, and extract the coordinates.
import geopandas as gpd
import numpy as np

# Replace by Raster function once done (valid coords)
rng = np.random.default_rng(42)
x_coords = rng.uniform(rast.bounds.left + 50, rast.bounds.right - 50, 50)
y_coords = rng.uniform(rast.bounds.bottom + 50, rast.bounds.top - 50, 50)

vals = rast.interp_points(points=list(zip(x_coords, y_coords)))
Replace by Vector function once done
<Axes: >
Important
The interpretation of where raster values are located differ, see XXX. The parameter shift_area_or_point (off by default) can be turned on to ensure
that the pixel interpretation of your dataset is correct.
Let’s look and redefine our pixel interpretation into "Point". This will shift interpolation by half a pixel.
Area
We can interpolate again by shifting according to our interpretation, and changing the resampling algorithm (default to “linear”).
vals_shifted = rast.interp_points(points=list(zip(x_coords, y_coords)), shift_area_or_point=True, method="quintic")
np.nanmean(vals - vals_shifted)
0.55906266
The mean difference in interpolated values is quite significant, with a 2 meter bias!
Total running time of the script: (0 minutes 0.258 seconds)