Transformations#
In GeoUtils, for all geospatial data objects, georeferenced transformations are exposed through the same functions
reproject(), crop() and translate(). Additionally,
for convenience and consistency during analysis, most operations can be passed a Raster or
Vector as a reference to match.
In that case, no other argument is necessary. For more details, see Match-reference functionality.
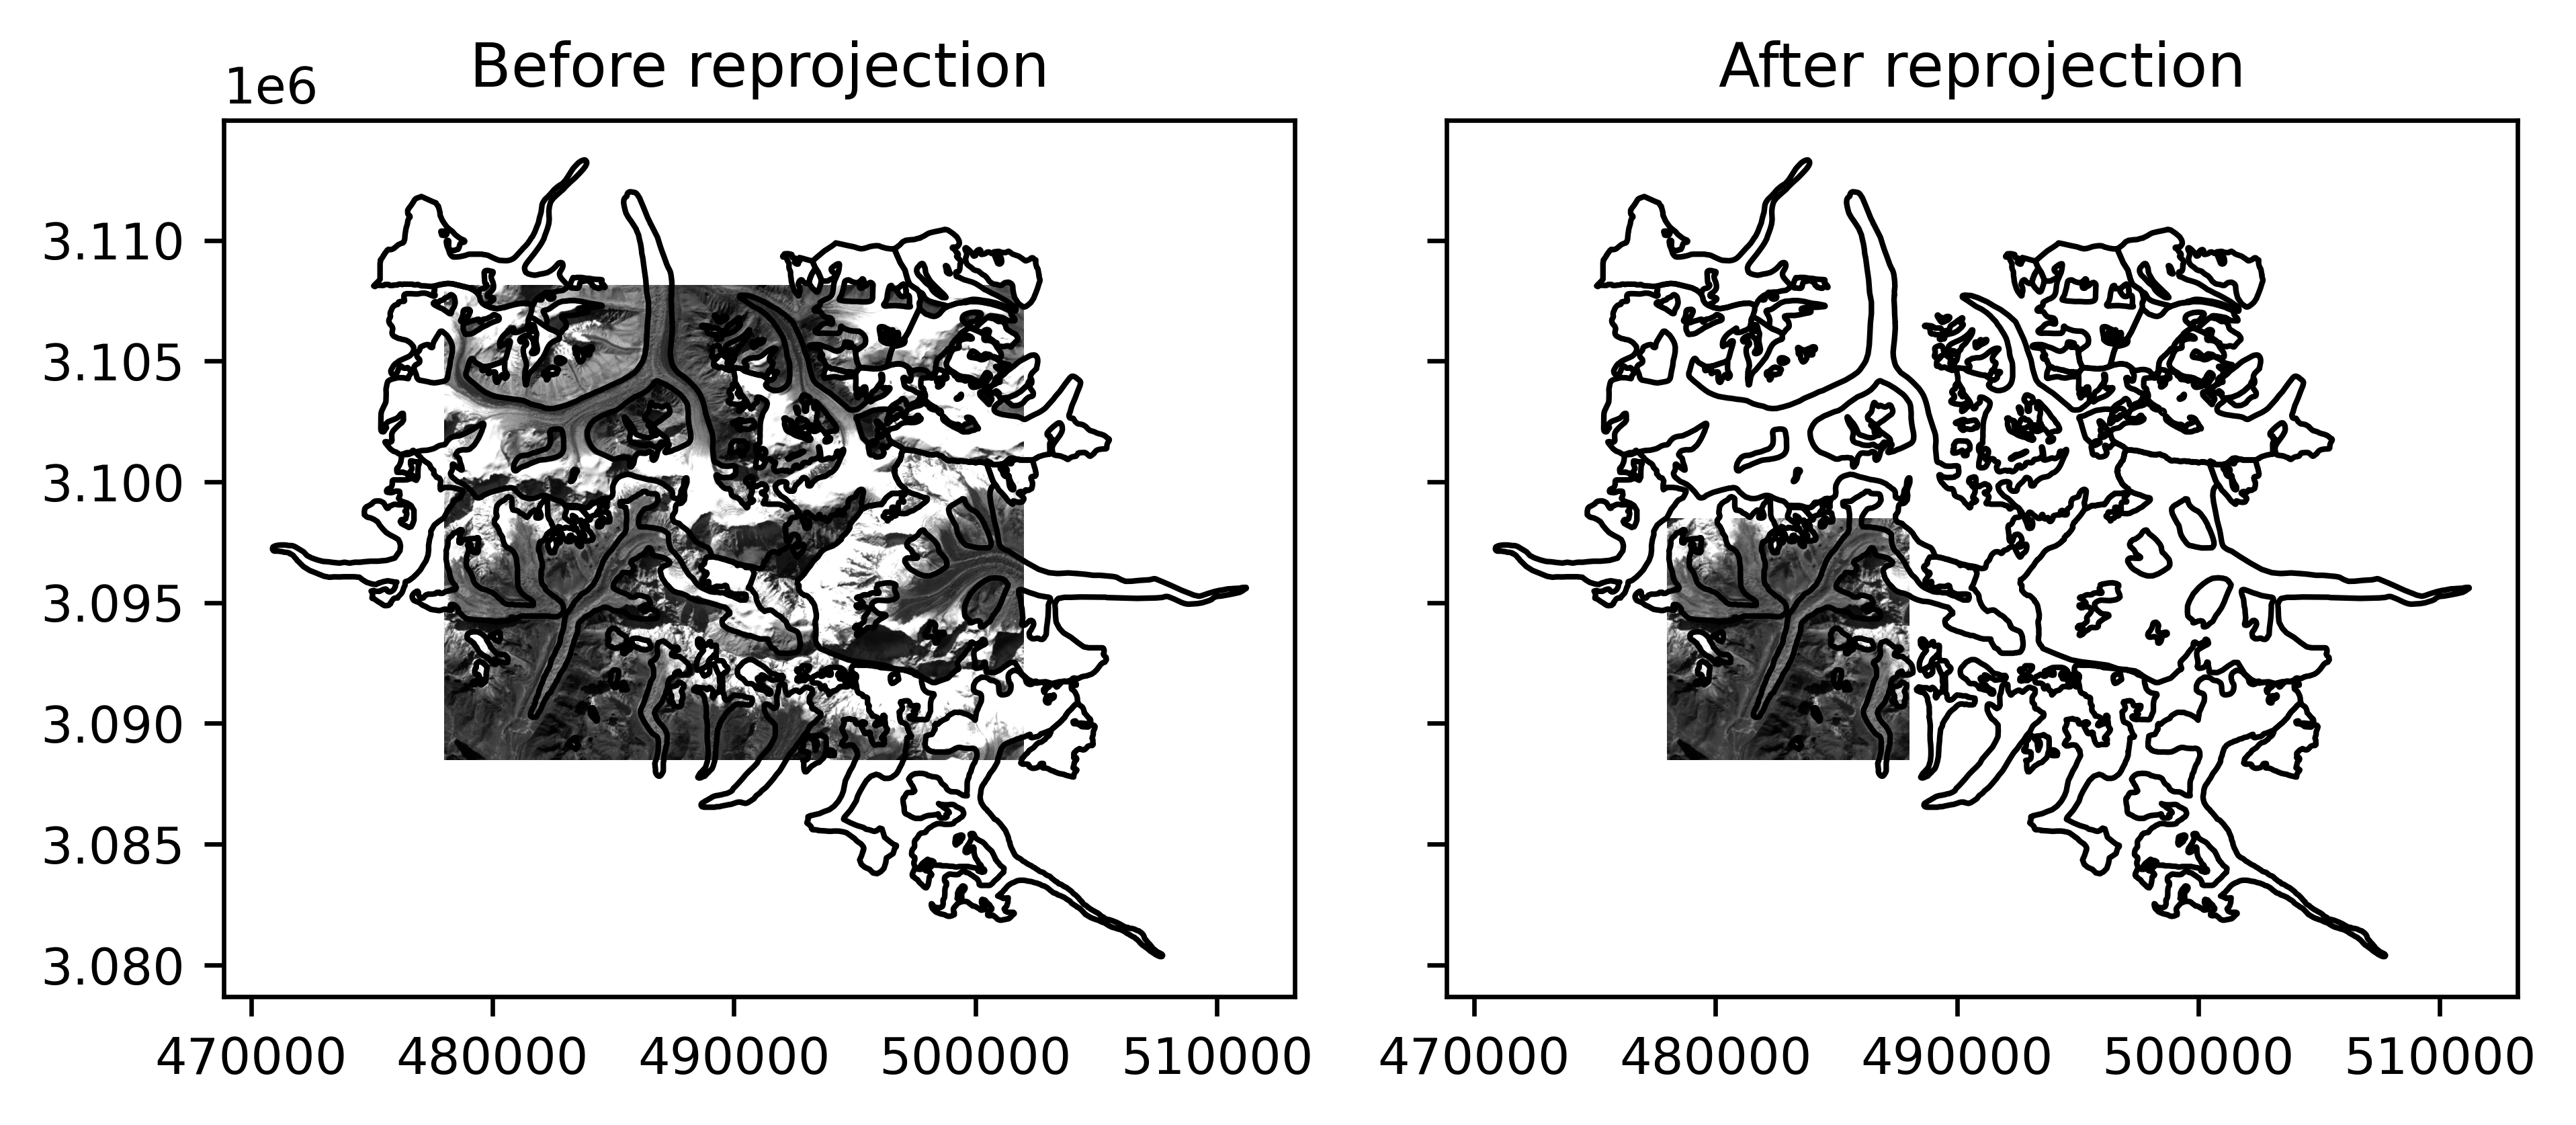
Reproject#
geoutils.Raster.reproject() or geoutils.Vector.reproject().
Reprojections transform geospatial data from one CRS to another.
For vectors, the transformation of geometry points is exact. However, in the case of rasters, the projected points do not necessarily fall on a regular grid and require re-gridding by a 2D resampling algorithm, which results in a slight loss of information (value interpolation, propagation of nodata).
For rasters, it can be useful to use reproject() in the same CRS simply for re-gridding,
for instance when downsampling to a new resolution res.
Tip
Due to the loss of information when re-gridding, it is important to minimize the number of reprojections during the analysis of rasters (performing only one, if possible). For the same reason, when comparing vectors and rasters in different CRSs, it is usually better to reproject the vector with no loss of information, which is the default behaviour of GeoUtils in raster–vector–point interfacing.
# Reproject vector to CRS of raster by simply passing the raster
vect_reproj = vect.reproject(rast)
# Reproject raster to smaller bounds and different X/Y resolution
rast_reproj = rast.reproject(
    res=(rast.res[0] * 2, rast.res[1] / 2),
    bounds={"left": rast.bounds.left, "bottom": rast.bounds.bottom,
            "right": rast.bounds.left + 10000, "top": rast.bounds.bottom + 10000},
    resampling="cubic")
Note
In GeoUtils, "bilinear" is the default resampling method. A simple str matching the naming of a rasterio.enums.Resampling method can be
passed.
Resampling methods are listed in the dedicated section of Rasterio’s API.
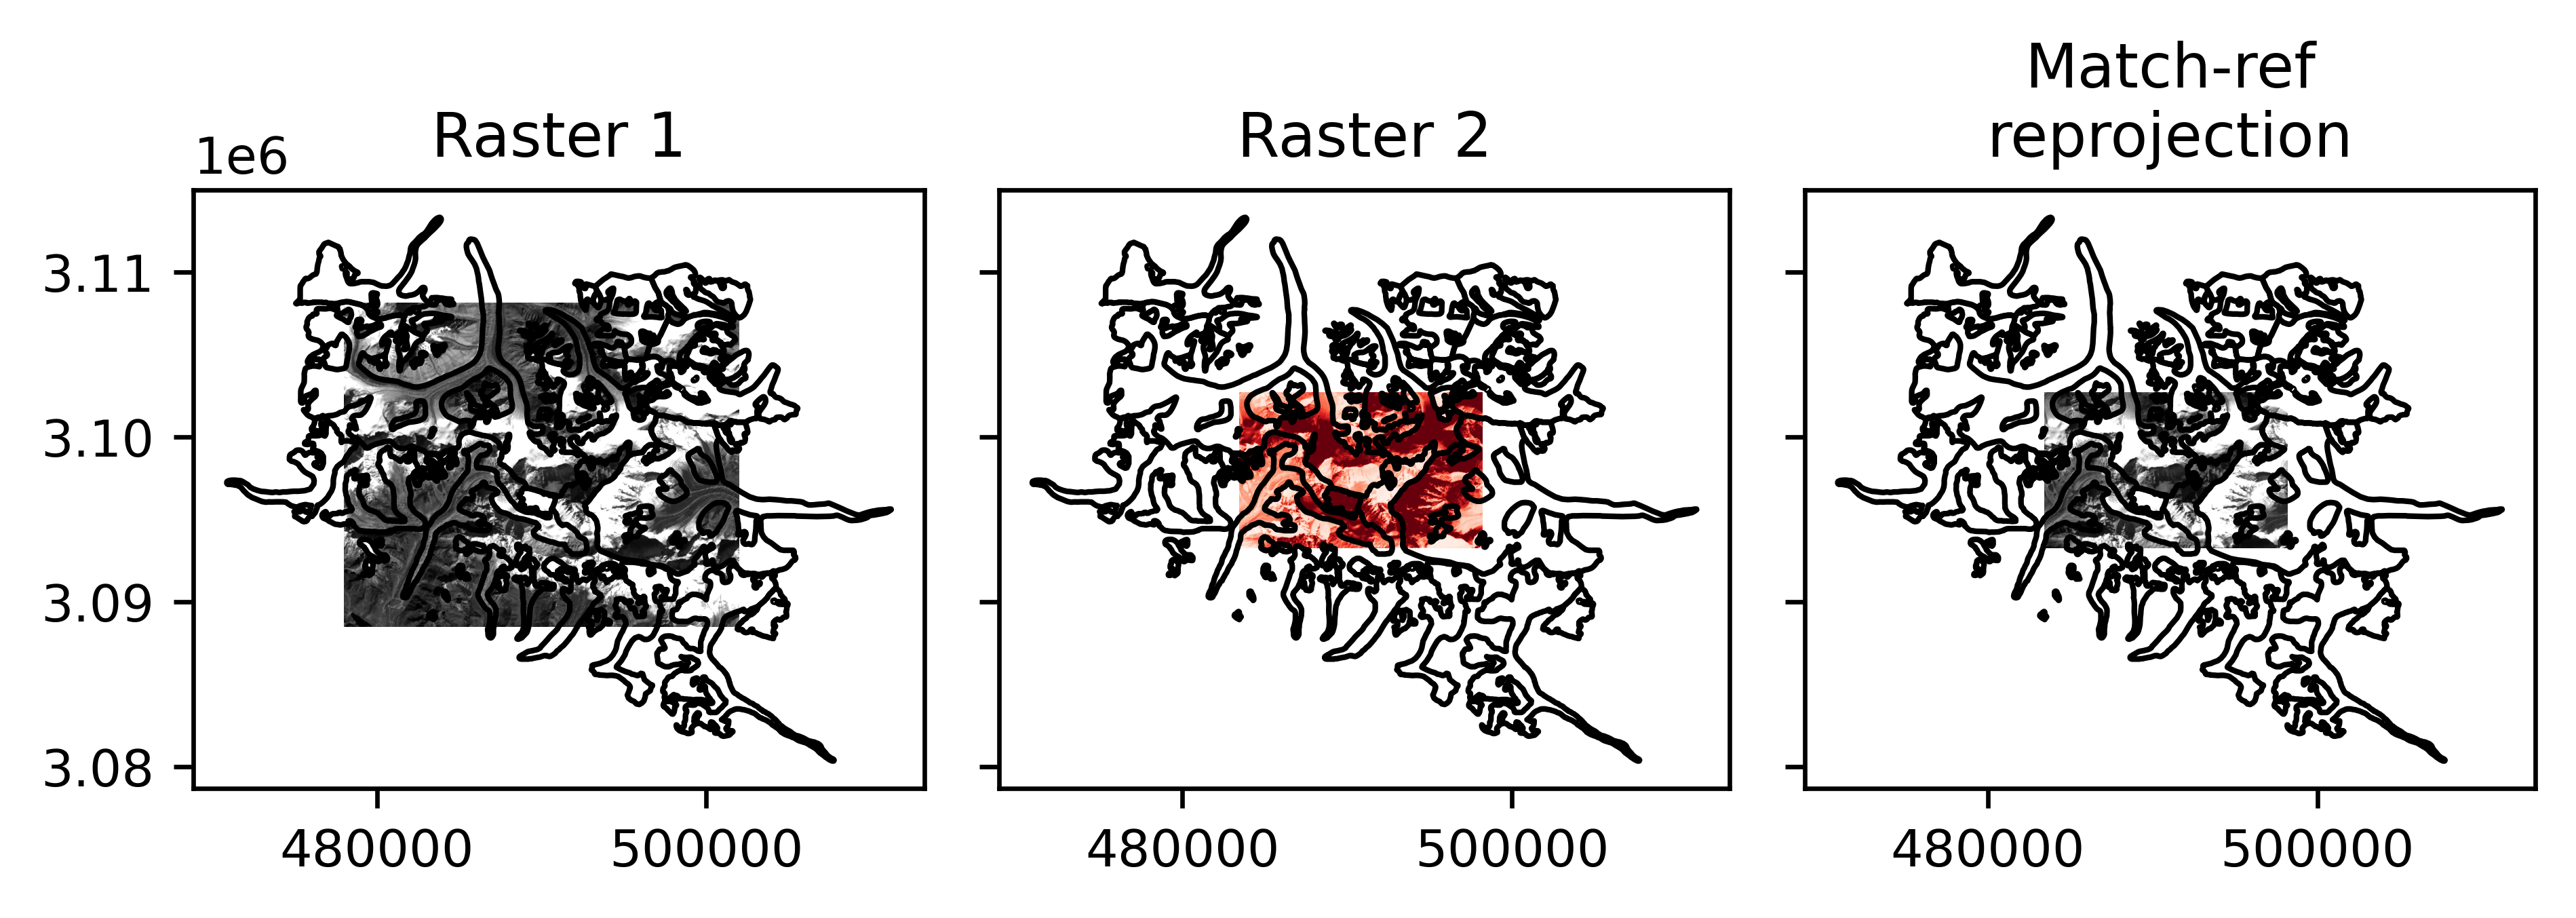
We can also simply pass another raster as reference to reproject to match the same CRS, and re-grid to the same bounds and resolution:
# Reproject vector to CRS of raster by simply passing the raster
rast_reproj2 = rast.reproject(rast2)
/home/docs/checkouts/readthedocs.org/user_builds/geoutils/checkouts/stable/geoutils/raster/georeferencing.py:225: UserWarning: One raster has a pixel interpretation "Area" and the other "Point". To silence this warning, either correct the pixel interpretation of one raster, or deactivate warnings of pixel interpretation with geoutils.config["warn_area_or_point"]=False.
  warnings.warn(message=msg, category=UserWarning)
GeoUtils raises a warning because the rasters have different Pixel interpretation, to ensure this is intended. This warning can be turned off at the package-level using GeoUtils’ Configuration.
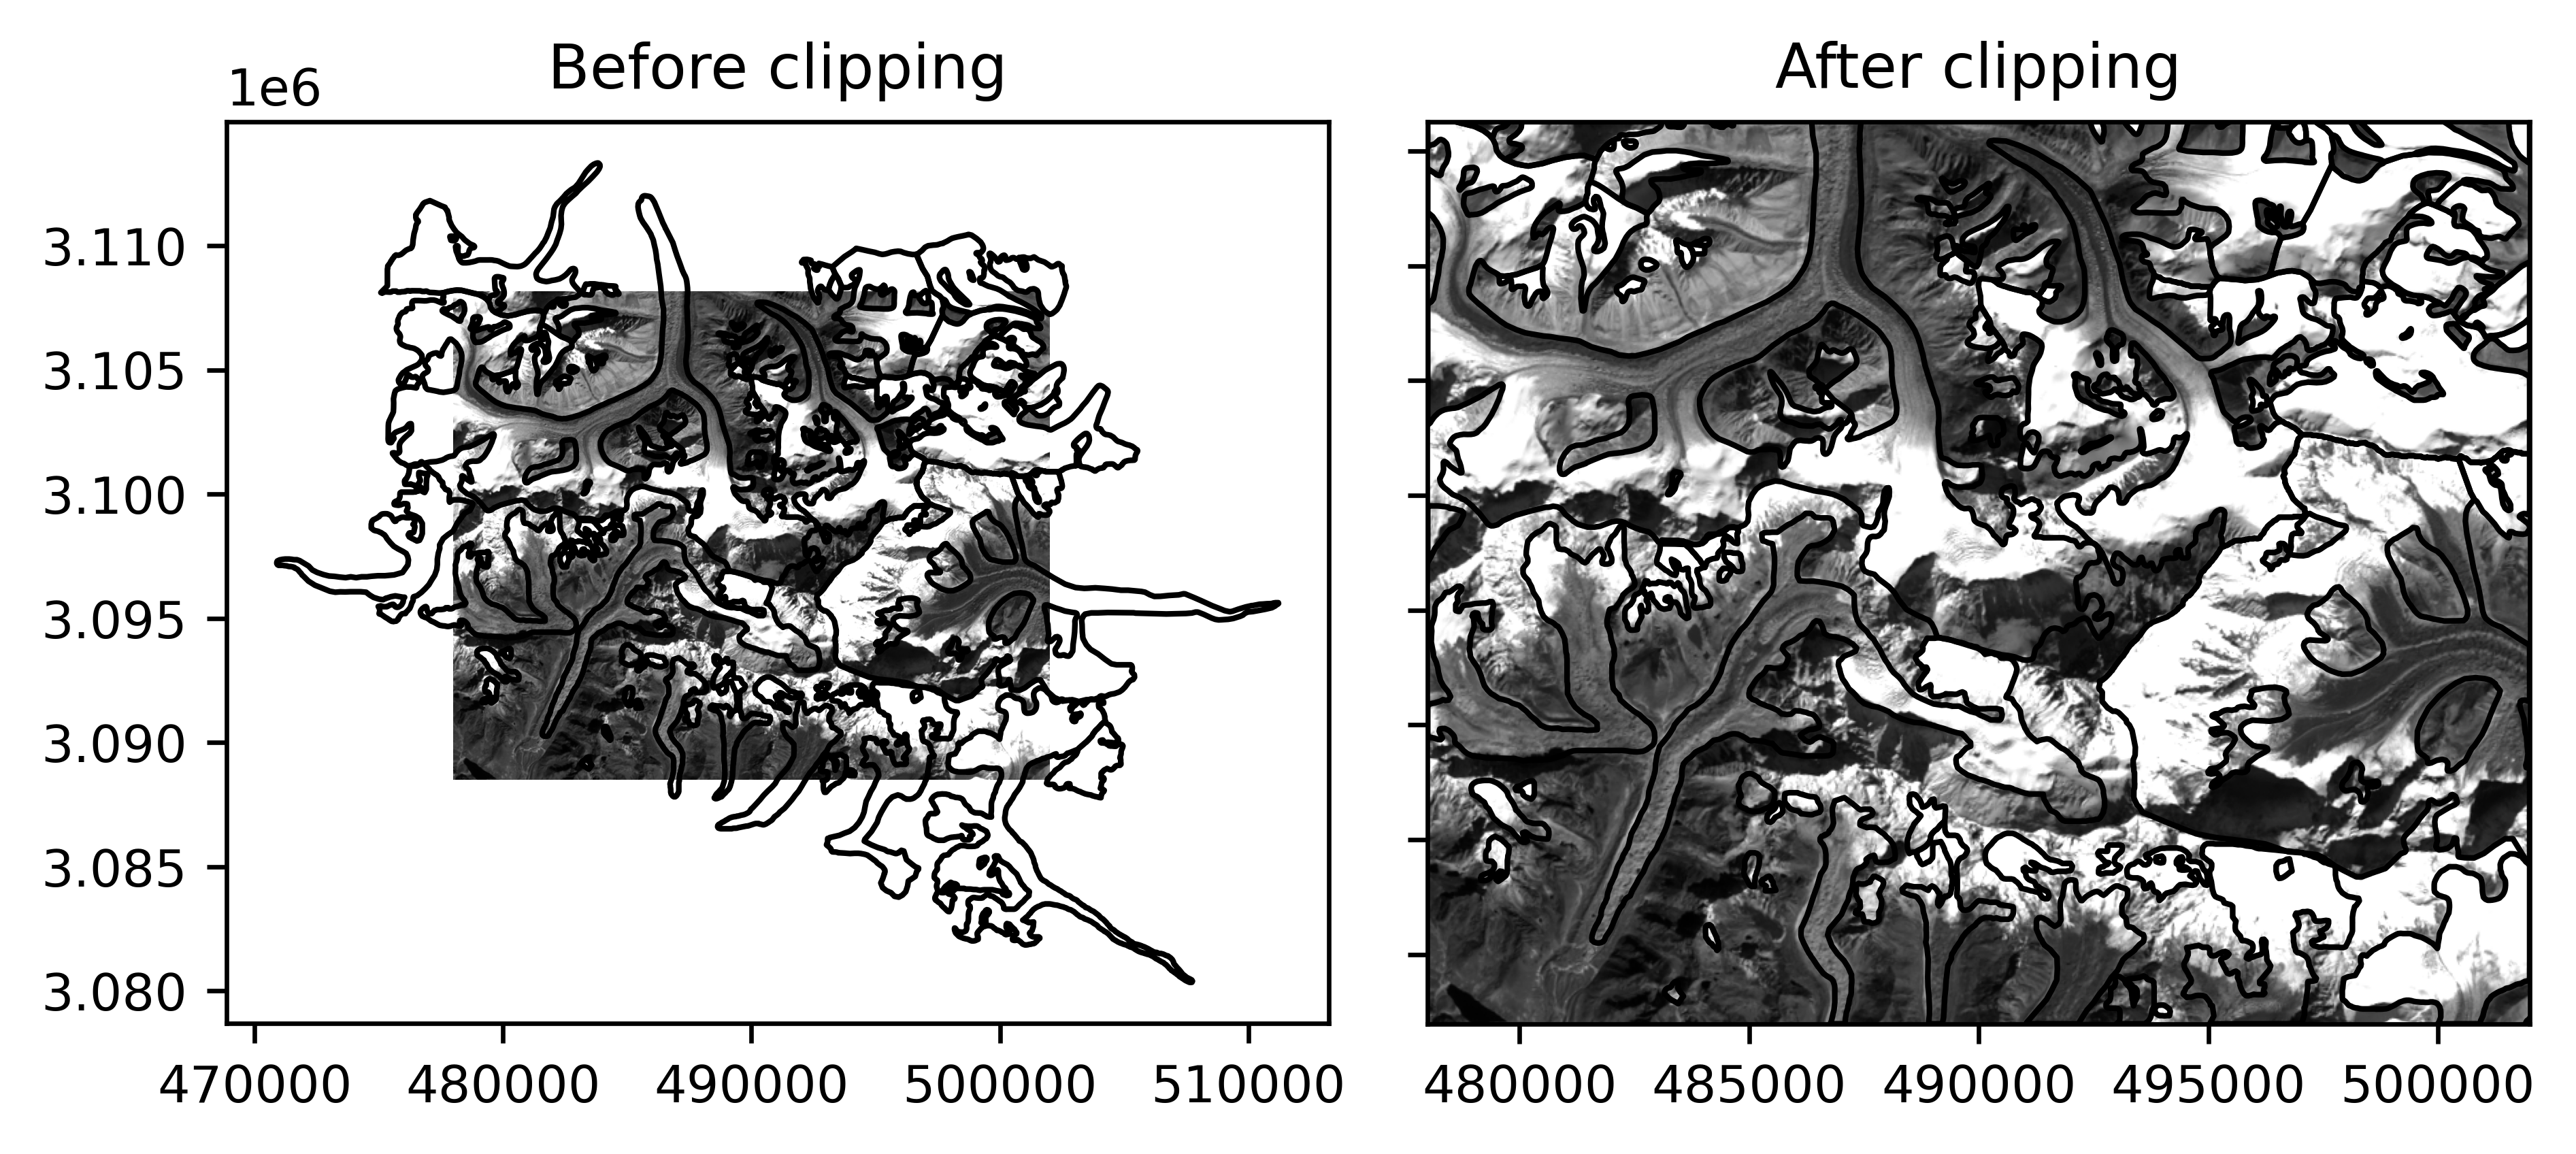
Crop or pad#
geoutils.Raster.crop() or geoutils.Vector.crop().
Cropping modifies the spatial bounds of the geospatial data in a rectangular extent, by removing or adding data (in which case it corresponds to padding) without resampling.
For rasters, cropping removes or adds pixels to the sides of the raster grid.
For vectors, cropping removes some geometry features around the bounds, with three options possible:
Removing all features not intersecting the cropping geometry,
Removing all features not contained in the cropping geometry,
Making all features exactly clipped to the cropping geometry (modifies the geometry data).
# Clip the vector to the raster
vect_clipped = vect_reproj.crop(rast, clip=True)
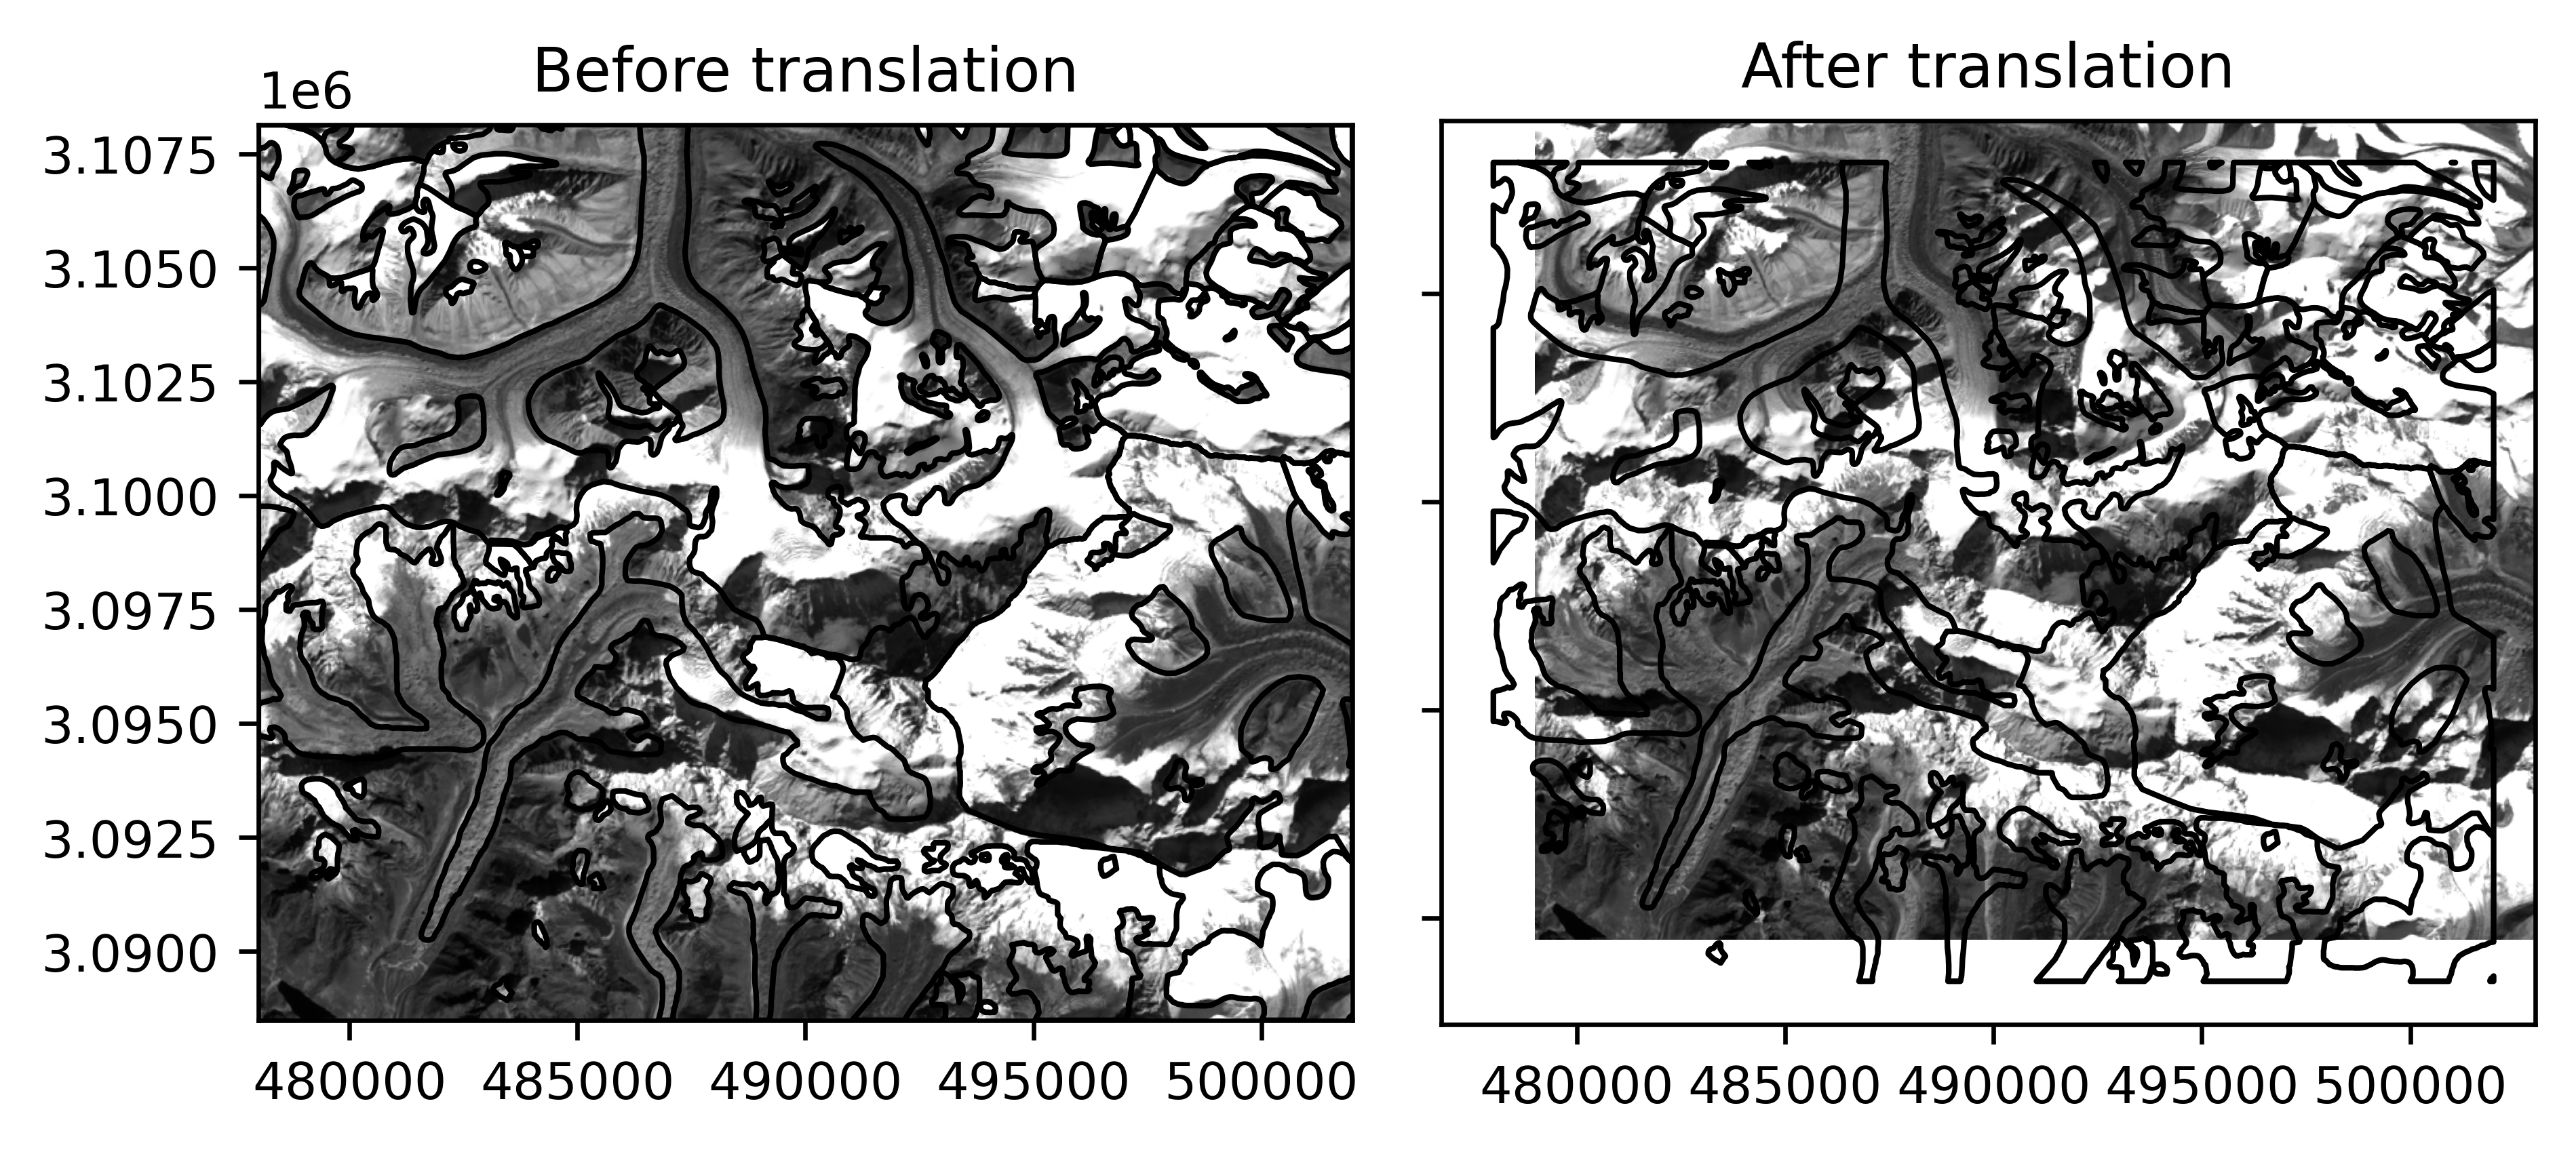
Translate#
geoutils.Raster.translate() or geoutils.Vector.translate().
Translations modifies the georeferencing of the data by a horizontal offset without modifying the underlying data, which is especially useful to align the data due to positioning errors.
# Translate the raster by a certain offset
rast_shift = rast.translate(xoff=1000, yoff=1000)
See also
For 3D coregistration tailored to georeferenced elevation data, see xDEM’s coregistration module.
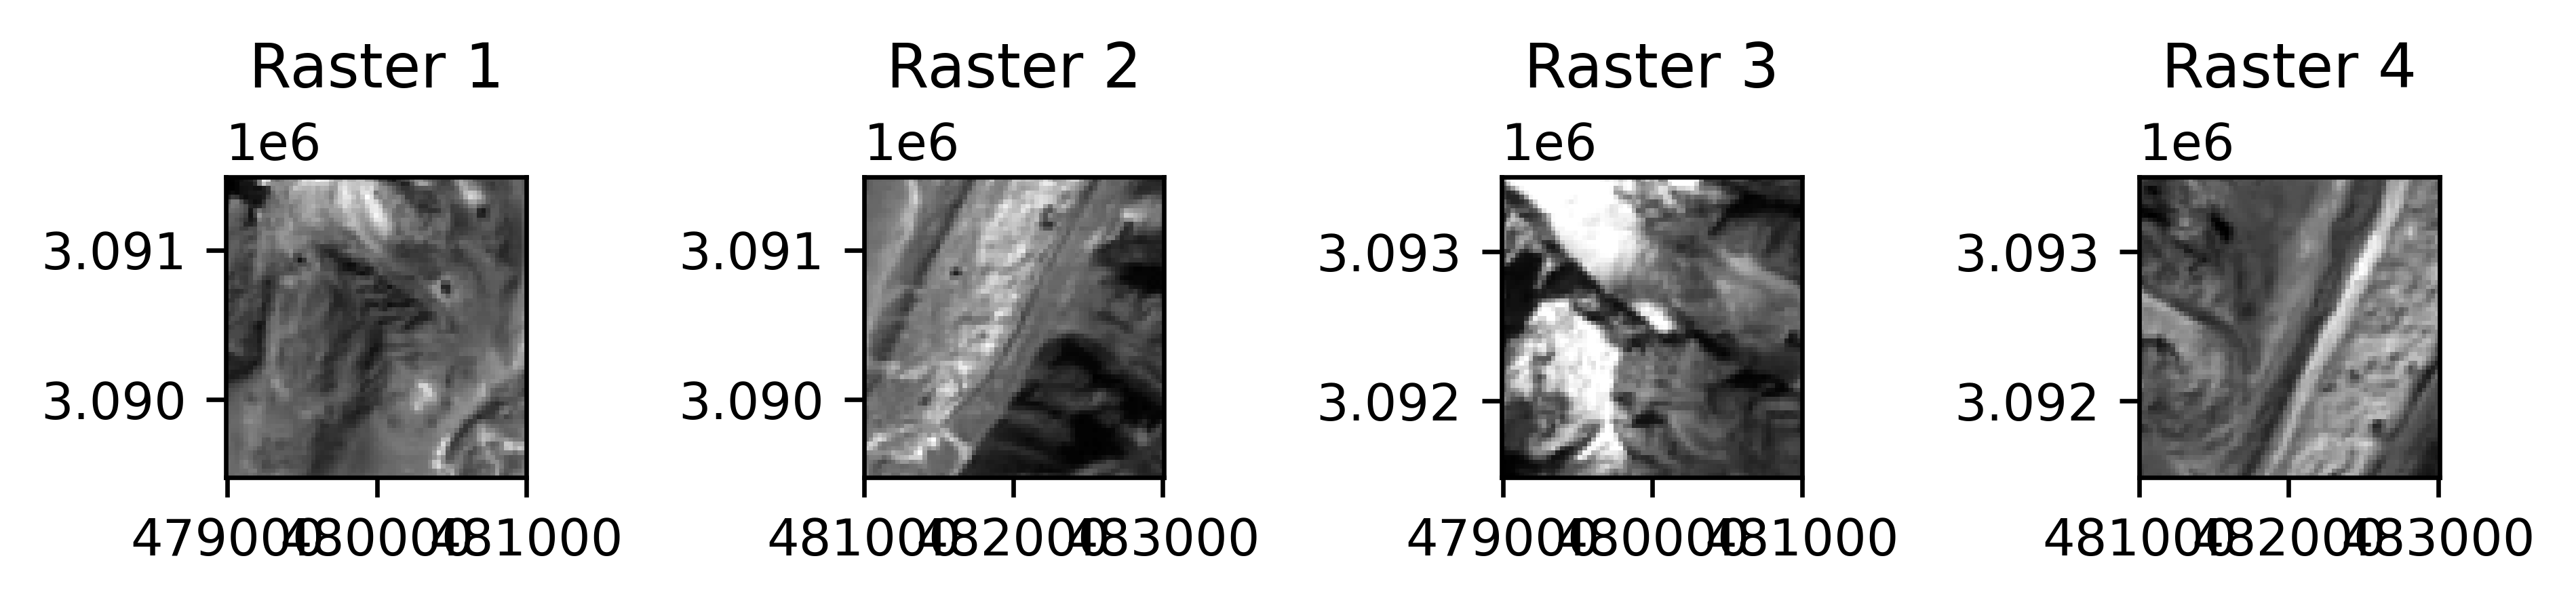
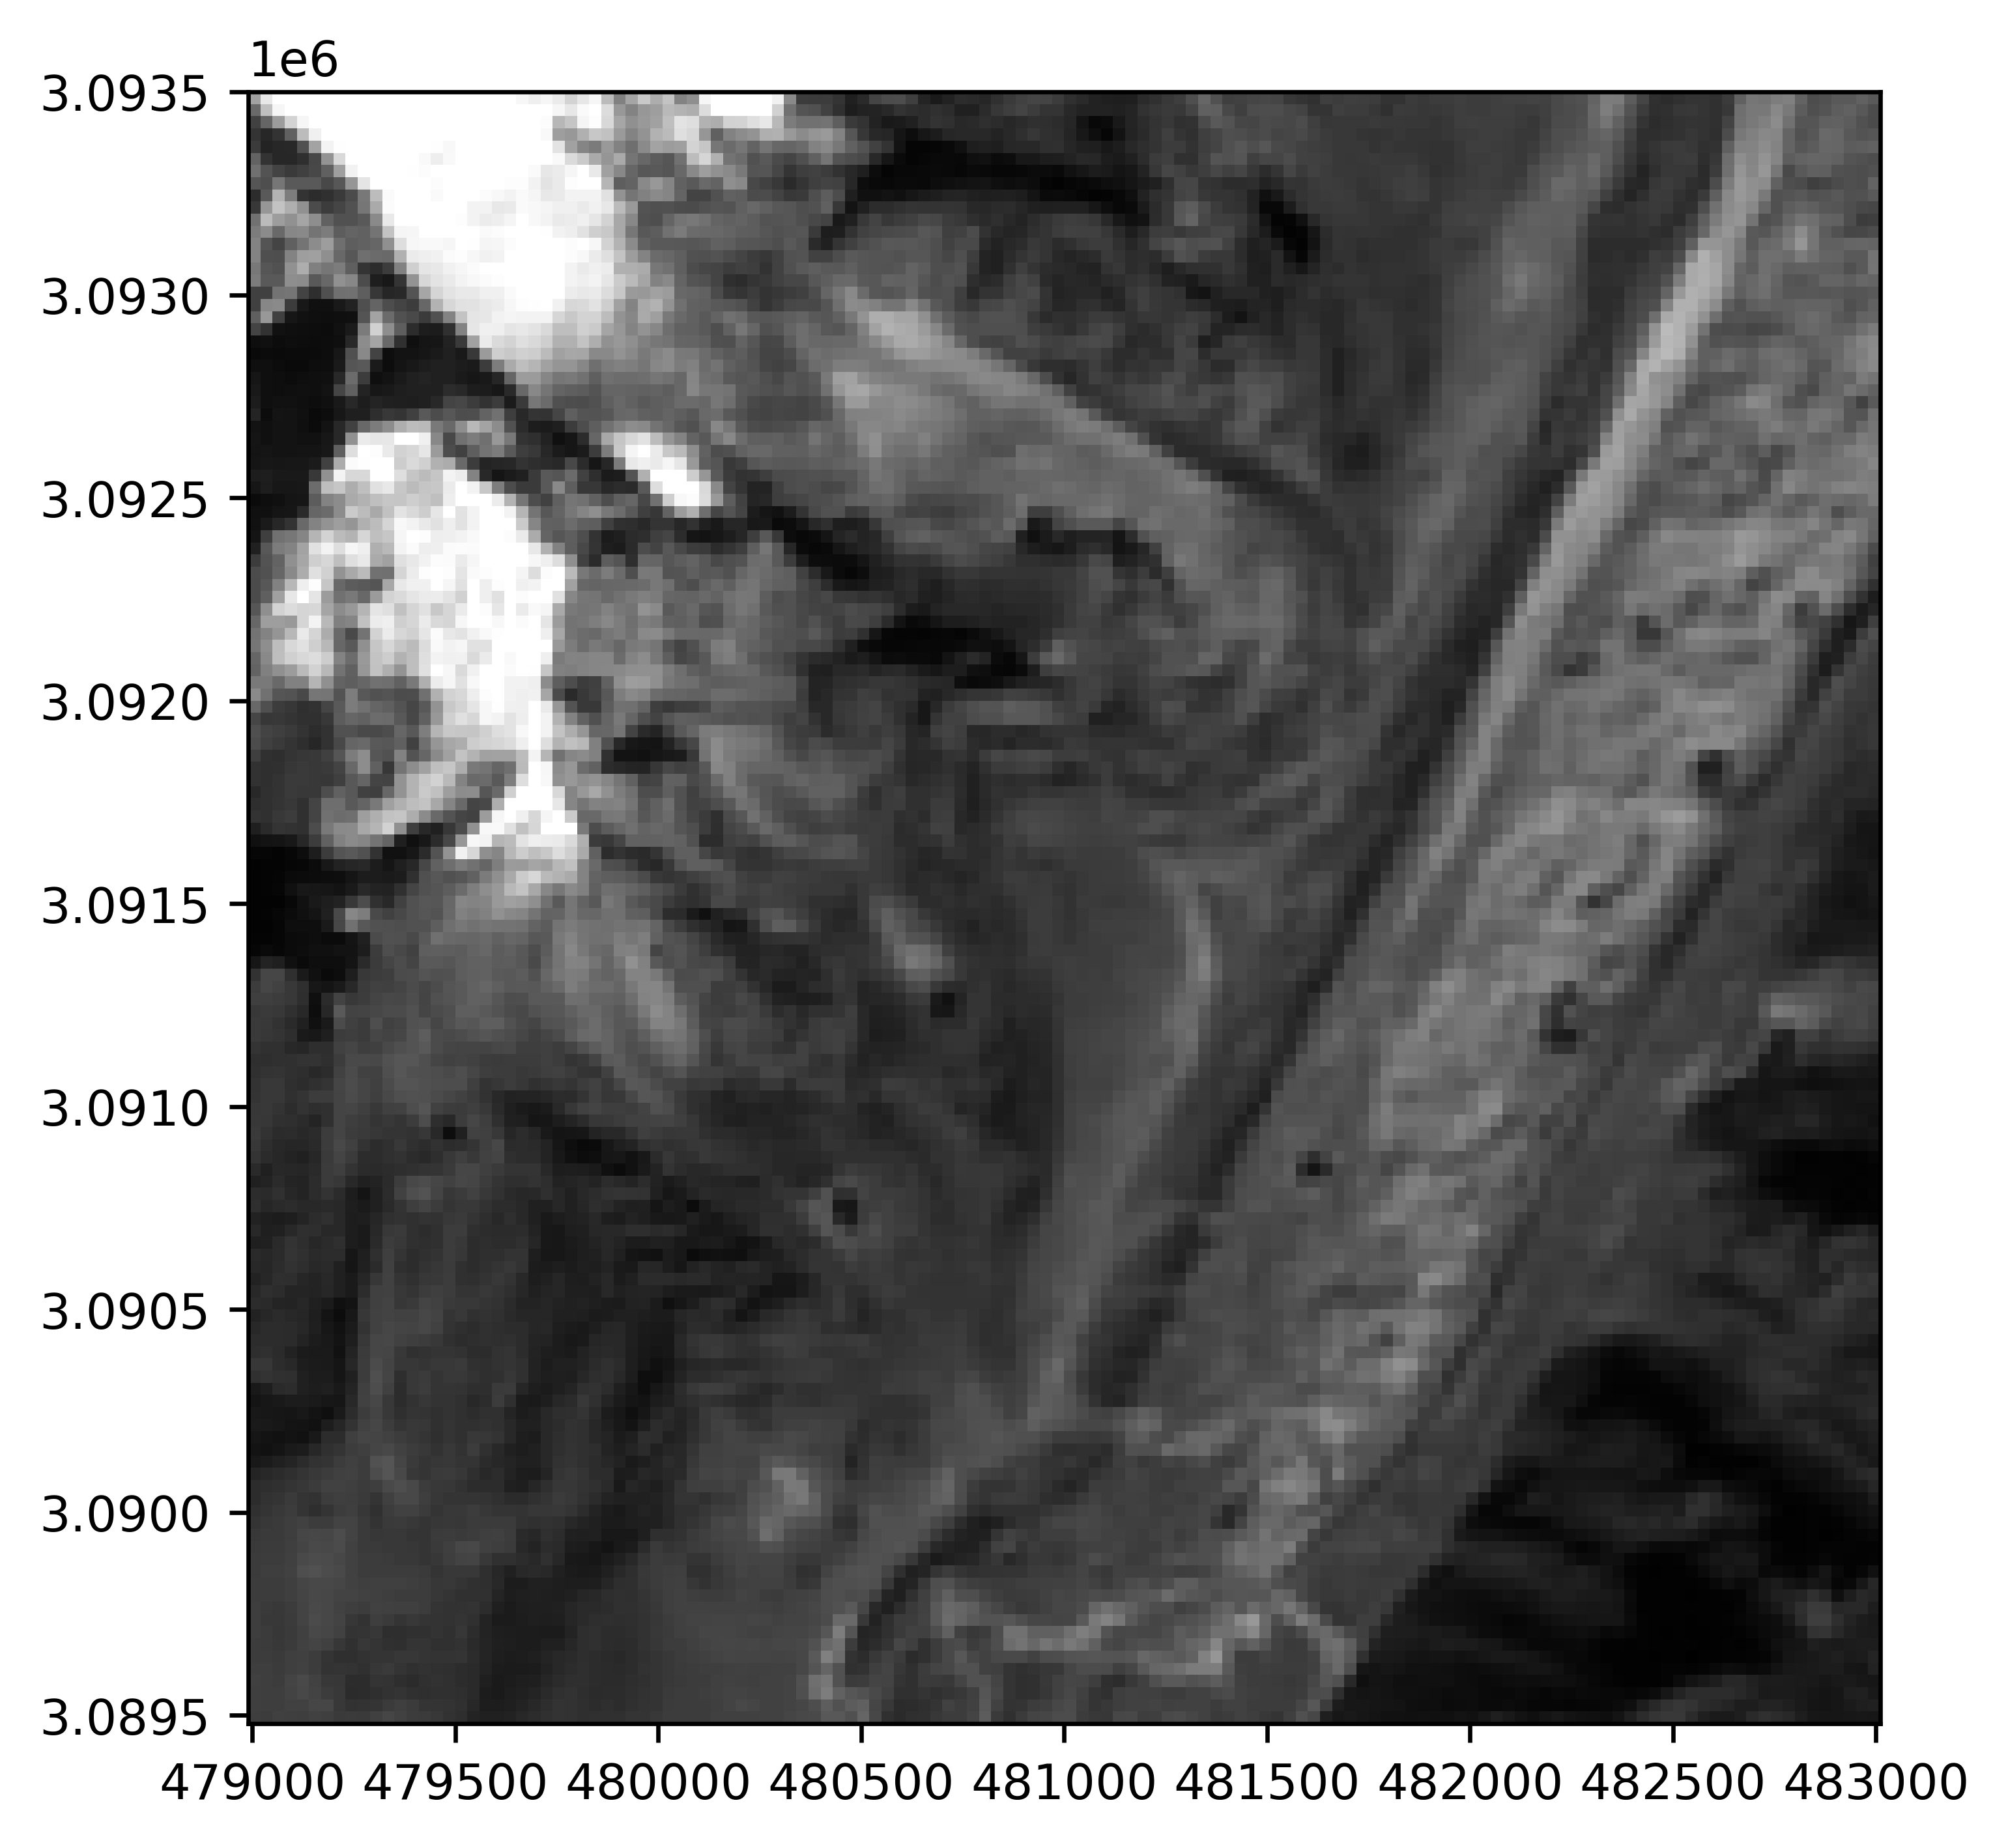
Merge#
geoutils.raster.merge_rasters()
Merge operations join multiple geospatial data spatially, possibly with different georeferencing, into a single geospatial data object.
For rasters, the merging operation consists in combining all rasters into a single, larger raster. Pixels that overlap are combined by a reductor function (defaults to the mean). The output georeferenced grid (CRS, transform and shape) can be set to that of any reference raster (defaults to the extent that contains exactly all rasters).
# Merging all rasters, uses first raster's CRS, res, and the extent of all by default
merged_rast = gu.raster.merge_rasters([rast1, rast2, rast3, rast4])